RUM Archive and Benford's Law
By Amit Singh on
Table of Contents
The Akamai mPulse team studies Real User Monitoring (RUM) data to help our customers understand how to optimize website performance and how user behavior may be altered by changes to configurations or resource requests on their site. As a data scientist on the mPulse team, I search for patterns in our data and identify problem areas on customer websites in order to recommend actionable improvements toward the end user experience.
Typically, I work with a specific customer’s dataset at any given time. However, there are cases where it is more appropriate to use an anonymized, aggregated dataset across many customers in order to investigate a change or patterns occurring across the web.
For example, we may want to measure the responsiveness of different types of devices[1], or perhaps geographic differences in patience waiting for a page to load[2]. Alternatively, we may want to validate an outage for a specific geographic region[3]. My colleagues and I at Akamai are afforded the opportunity to conduct these analyses by means of working on the mPulse product.
However, what if a Web Perf enthusiast external to Akamai wanted to perform similar types of analyses? Enter the RUM Archive - a publicly available and queryable dataset of RUM data, consisting of anonymized page loads and resource fetches.
RUM Archive
While the RUM Archive is in beta (at least at the time of this writing), it offers anyone the ability to query and investigate a rich dataset of RUM data[4], allowing them to pose their own questions and hypotheses before diving into the data themselves. Nic Jansma wrote a recent post introducing the RUM Archive which outlines the motivation for the project and how one can access the data.
Now, I don’t have any reason to believe my colleagues who have put this product together fabricated any part of this dataset, or are looking to deceive users of the RUM Archive. With that said, I started to think if there was a way I could mathematically prove to myself that the data underlying the RUM Archive truly is a legitimate dataset coming from real Web Performance data. It turns out there is a phenomenon that occurs in many real world numerical datasets which shows that the data follows a fairly predictable pattern[5].
Benford's Law
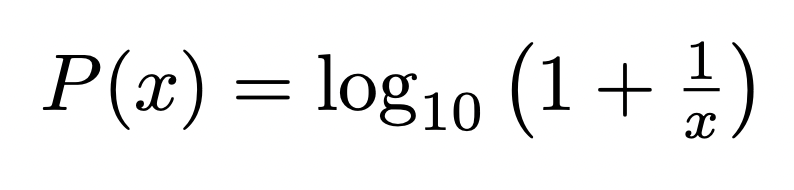
The phenomenon in question is referred to as Benford’s Law (sometimes referred to as the First Digit Law) and states that for a given distribution of data, the leading digit for each data point is more likely than not to be a smaller number. You may reason that there are 9 numbers that can be leading digits (1 - 9) so the distribution would be more or less Uniform, meaning that the number 1 would show up as the leading digit roughly 11% of the time. And this would be the same for the number 2, the number 3, and so on… all the way to the number 9. In reality, Benford’s Law states that the number 1 appears as the leading digit about 30% of the time, while the number 9 appears as the leading digit less than 5% of the time. The numbers (1-9) follow a logarithmic pattern given by:
This results in the following predicted probabilities for each possible leading digit (value of x in the above equation).
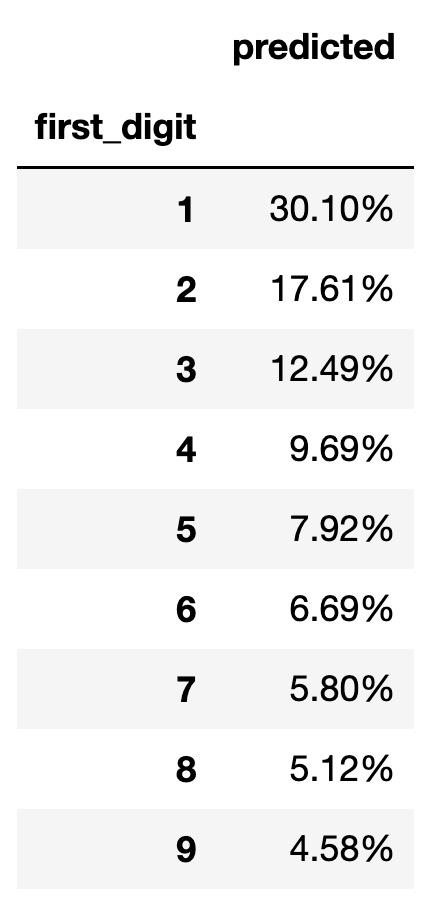
For those interested, this table is given by the following Python code:
d = {'first_digit' : range(1,10), 'predicted' : [round(np.log10(1+1/x),4) for x in range(1,10)]}
df = pd.DataFrame(data=d).set_index('first_digit')
df.predicted = df.predicted.map('{:.2%}'.format)
display(df)
Benford’s Law is not just a cool phenomenon that occurs in many real world datasets. It also has a host of practical applications in the realm of fraud detection. However, that deserves an entire post dedicated to the topic[6]. For now, let’s get back to the RUM Archive.
Back to the RUM Archive
So, how can we use this knowledge to verify that the data from the RUM Archive is in fact real data? Well, we can query for one of our numeric columns in the data provided by the RUM Archive and check how often each value begins with the possible leading digits, 1 through 9. If Benford’s Law holds, we should see that the distribution of leading digits more or less follows the percentages given by the predicted percentages table above. Given we are analyzing Web Performance data, Average Page Load Time (PLT)[7] seems to be a natural choice here, as we can expect to have a wide range of user experiences spanning from very slow to very fast pages. Note, however, that we could have chosen a host of other columns in the database to test against Benford’s Law.
BigQuery
Let’s now run some queries within the Google BigQuery platform and utilize data from the RUM Archive. We will be using the table named akamai-mpulse-rumarchive.rumarchive.rumarchive_page_loads, and specifically the PLTAVG column.
First, we run a query to obtain the first digit for each value of the PLTAVG column, as well as how often each of these occur.
SELECT first_digit, count(*) as instances
FROM (
  SELECT PLTAVG, CAST(LEFT(CAST(PLTAVG AS STRING), 1) AS INT) as first_digit
  FROM    `akamai-mpulse-rumarchive.rumarchive.rumarchive_page_loads`
  WHERE   DATE BETWEEN "2022-09-01" AND "2022-10-01"
)
GROUP BY first_digit
ORDER BY first_digit ASC
Next, we recreate the values from the predicted percentages table by employing the LOG function.
SELECT first_digit, LOG(1 + (1/ first_digit), 10) as frequency
FROM UNNEST([1,2,3,4,5,6,7,8,9]) AS first_digit
Lastly, we put it all together by joining these two results on the first_digit column. The resulting query is as follows:
-- Expected Frequency Distribution
WITH frequency_table AS (
 SELECT first_digit, LOG(1 + (1/ first_digit), 10) as frequency
 FROM UNNEST([1,2,3,4,5,6,7,8,9]) AS first_digit
),

-- Actual Frequency Table
rum_archive_plt AS (
 SELECT first_digit, count(*) as instances
 FROM (
   SELECT PLTAVG, CAST(LEFT(CAST(PLTAVG AS STRING), 1) AS INT) as first_digit
   FROM    `akamai-mpulse-rumarchive.rumarchive.rumarchive_page_loads`
   WHERE   DATE BETWEEN "2022-09-01" AND "2022-10-01"
 )
 GROUP BY first_digit
 ORDER BY first_digit ASC
)

-- Side by Side Results
SELECT t1.first_digit, ROUND(t1.frequency, 4) as predicted_freq, ROUND(t2.instances / SUM(t2.instances) OVER (), 4) as actual_freq
FROM frequency_table AS t1
INNER JOIN rum_archive_plt AS t2 ON t1.first_digit = t2.first_digit
ORDER BY t1.first_digit ASC
Here are the results:
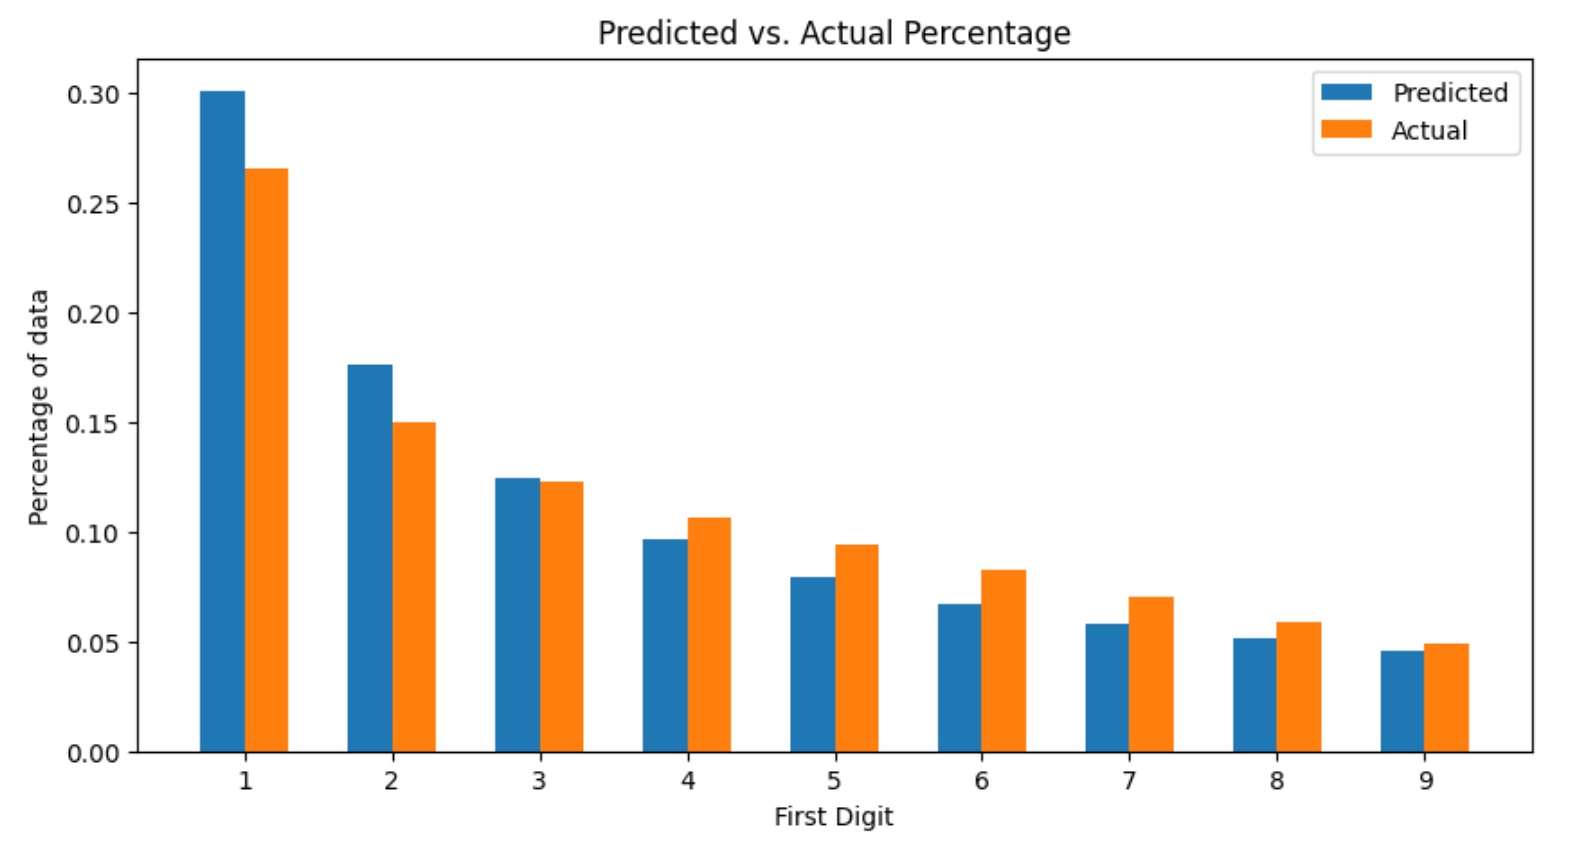
| first_digit | predicted_freq | actual_freq |
|---|---|---|
| 1 | 0.3010 | 0.2662 |
| 2 | 0.1761 | 0.1498 |
| 3 | 0.1249 | 0.1225 |
| 4 | 0.0969 | 0.1068 |
| 5 | 0.0792 | 0.0946 |
| 6 | 0.0669 | 0.0826 |
| 7 | 0.0580 | 0.0700 |
| 8 | 0.0512 | 0.0587 |
| 9 | 0.0458 | 0.0488 |
While there are some discrepancies, it appears by and large that Benford’s Law does hold for PLTAVG within the RUM Archive data. There are many different types of user experiences captured in this data - slow pages, fast pages, and everything in between. It is reasonable to conclude that the leading digit for each data point is random. And yet the results indicate that the RUM Archive data follows this very predictable pattern that appears time and time again. With this knowledge, we can reasonably expect that many of the other fields[8] available to us would follow this expected Benfordian pattern.
It is worth mentioning that there are a number of caveats to the preparation of the RUM Archive data, and this may explain away some of the discrepancies we see in the predicted versus actual percentages in the above results. The main caveats pertinent to the analysis in this post include that the RUM Archive data is sampled, only contains data from Akamai mPulse (which biases the dataset towards customers of the mPulse product), and outliers are excluded by necessity[9] in order to maintain anonymity of the data.
Final Thoughts
If you get a chance, please check out the RUM Archive and share your experience with the mPulse team. You may also contribute to the project here.
Additionally, I encourage you to look for Benford’s Law in your own datasets. Despite being counterintuitive, it is surprising how often this phenomenon holds true.
Reliably Measuring Responsiveness - Nic Jansma (Akamai) and Shubhie Panicker (Google) ↩︎
Understanding Emotion for Happy Users - Philip Tellis (Akamai) ↩︎
Zimbabwe Internet Shutdown via Akamai mPulse RUM Data - Amit Singh (Author) ↩︎
Documentation on how to query the RUM Archive are listed here. Note that it requires access to Google BigQuery, which may have a cost associated with its usage depending on the amount of data used. ↩︎
Assuming sufficient conditions are met for the data distribution. For more information, please visit here. ↩︎
We use Average PLT due to the fact that data from the RUM Archive is aggregated. This means that each row of data corresponds to multiple user experiences that share attributes from other columns. The PLT value is then the average of those user experiences. ↩︎
Refer to the table schema for all the available fields. ↩︎
Since the RUM Archive data is aggregated, there is a minimum count threshold applied which by definition excludes outliers that do not occur at a sufficiently high rate. ↩︎