Querying
Table of Contents
Introduction
RUM Archive datasets are stored in Google BigQuery.
To execute queries against RUM Archive datasets, you will need a Google account.
Note: BigQuery has costs for storage and querying. You'll want to review what's available in the free tier, and estimate how much querying the RUM Archive may cost. You can read our tips on how to reduce your BigQuery costs.
Datasets
Each provider of RUM Archive data will store their datasets in a different location.
Review the datasets documentation for information on where each dataset is located within BigQuery.
The rest of this guide will assume you're querying against the Akamai mPulse RUM dataset.
Accessing BigQuery
The first step in querying RUM Archive data is gaining access to Google BigQuery and the desired datasets.
Follow the steps below to link (or create) a BigQuery project to the desired RUM Archive datasets.
- Log into the Google Cloud Projects starting page:
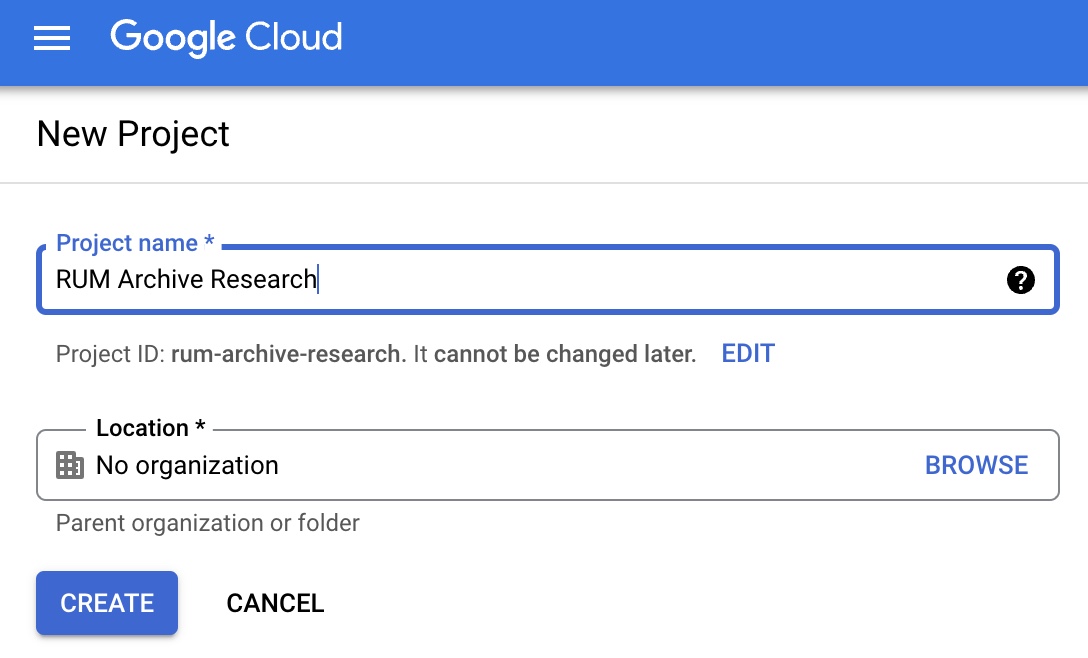
- Create a new, or use an existing Project:

- You can name a new Google Cloud Project whatever you wish:
- Head over to the BigQuery Console for your new project:
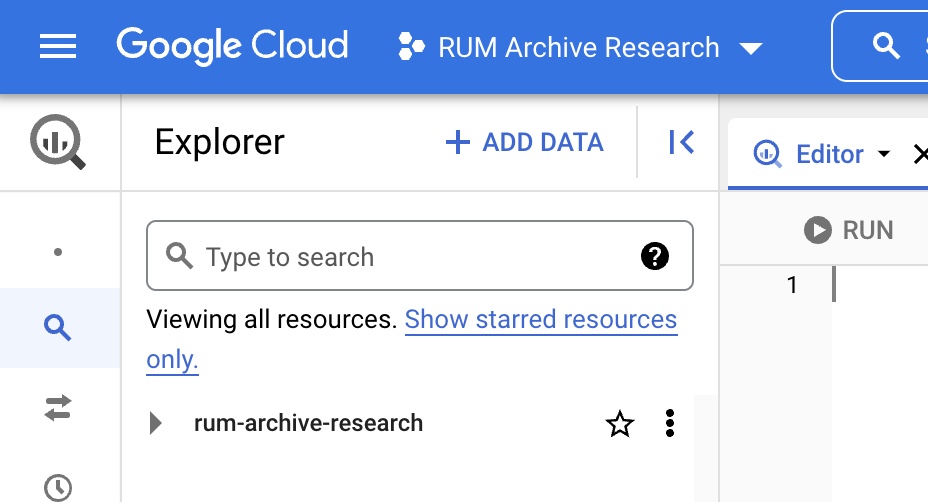
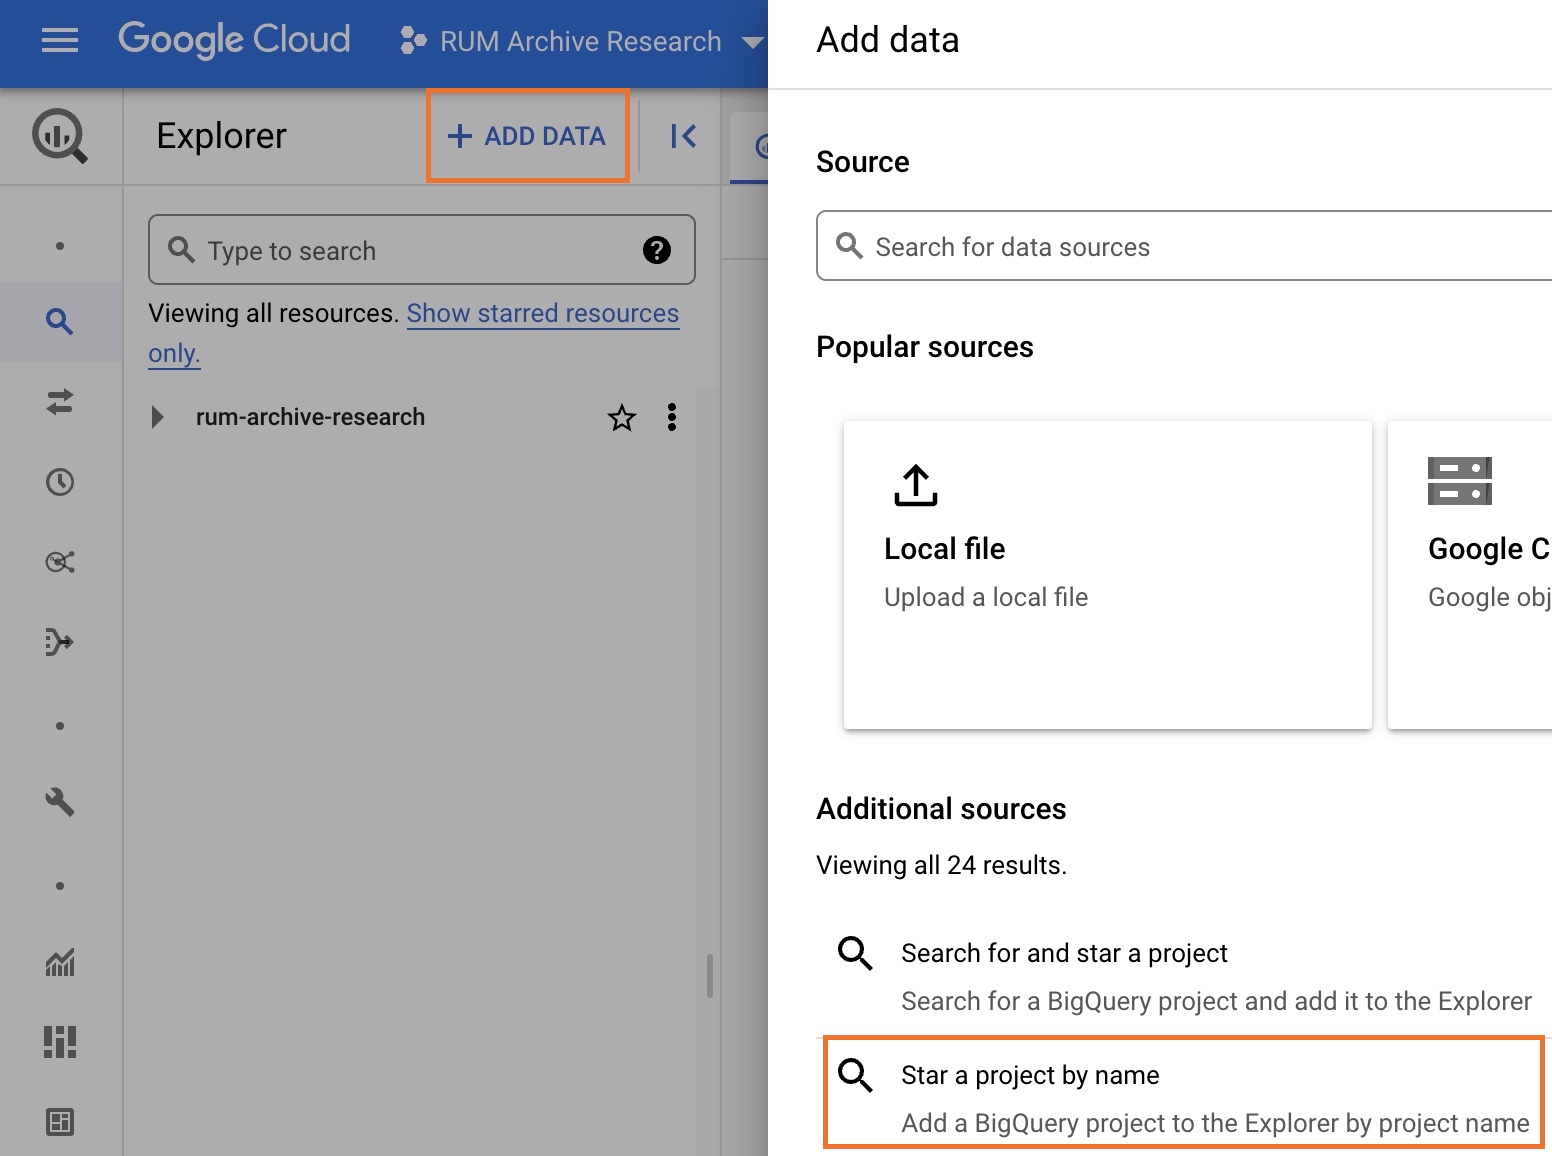
- We're going to add the desired datasets to your BigQuery console. Click on + Add Data and select Star a project by name:
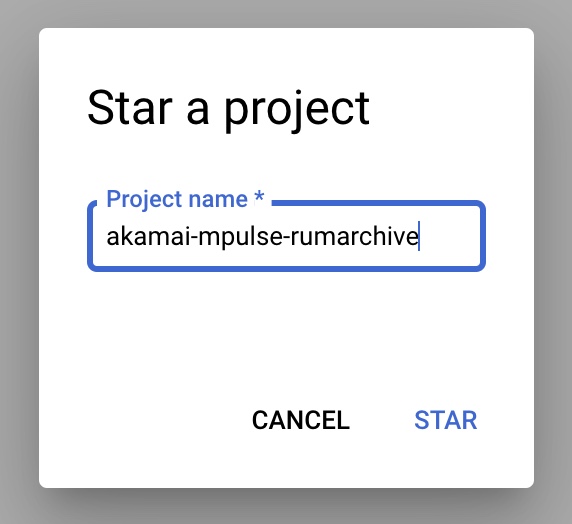
- The shared BigQuery project name should be listed in the dataset definitions. In this case, we'll add the Akamai mPulse RUM dataset which is under the
akamai-mpulse-rumarchiveproject:
- You should now see the desired dataset starred in your BigQuery Console:
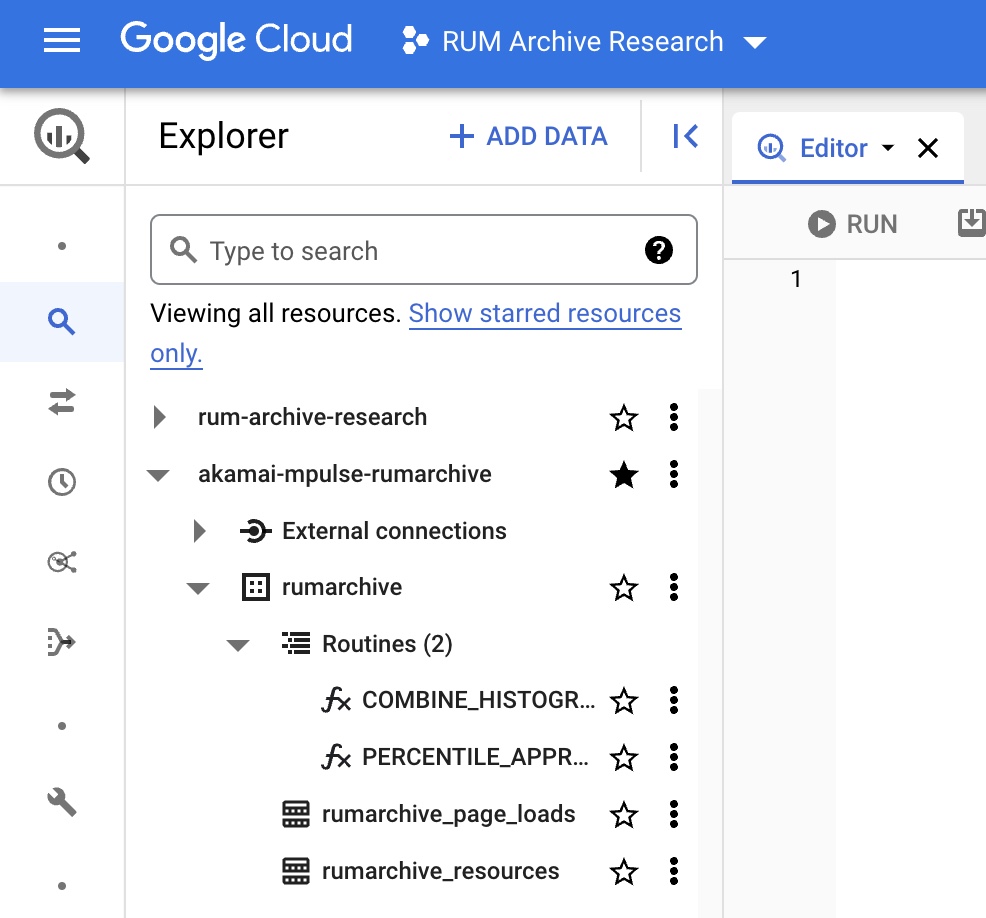
You're all set, and ready to query RUM Archive data.
Aggregation
All of the data represented in RUM Archive BigQuery tables is aggregated. This means that each row represents more than one datapoint. In fact, some rows can represent hundreds, thousands or millions of datapoints.
To understand how the aggregated rows are generated, please review the methodology guide.
When querying RUM Archive data, you will be executing standard BigQuery SQL queries against these pre-aggregated rows of data. From those rows, you should be able to execute any of the calculations listed below.
High-Level Example
To illustrate how RUM Archive data is stored with a simple example, please consider 4 unique page loads, using two dimensions (User Agent Family, Country) that track a single Timer (Page Load Time):
| Page Load # | User Agent Family | Country | Page Load Time (ms) |
|---|---|---|---|
| 1 | Chrome | US | 100 |
| 2 | Chrome | DE | 200 |
| 3 | Safari | US | 300 |
| 4 | Safari | US | 350 |
Stored in RUM Archive format, there are 3 unique tuples of dimensions, so there would be 3 rows of aggregated data:
| User Agent Family | Country | PLTCount | PLTHistogram | PLTAvg | PLTSumLn |
|---|---|---|---|---|---|
| Chrome | US | 1 | {"1":[100,1]} |
100 | 4.605 |
| Chrome | DE | 1 | {"2":[200,1]} |
200 | 5.298 |
| Safari | US | 2 | {"3":[325,2]} |
325 | 11.561 |
With data in this format, one can calculate many statistics such as any (approximate) percentile, averages, and geometric means.
More information:
Querying
Each row will contain dimensions, counts and timers/metrics.
- Dimensions are used to aggregate, filter and group by data.
- Counts are used to understand relative weights of each dimension, and used in most of the statistical calculations
- Each Timer and Metric has several columns associated with it to aid in the statistical calculations below
For details on how each RUM Archive table is structured, please see the tables documentation.
Note: Most RUM Archive queries should be limited to a single DATE (or range) as the RUM Archive tables are partitioned by it. If you exclude a DATE clause, you will be scanning an entire dataset, which can be costly.
Aggregating
Since RUM Archive data is pre-aggregated, you can apply standard SQL commands to the BEACONS (overall matches) and xyzCOUNT columns to understand relative totals of the data.
SELECT  COUNT(*) as ROWCOUNT,
        SUM(BEACONS) as BEACONCOUNT
FROM    `akamai-mpulse-rumarchive.rumarchive.rumarchive_page_loads`
WHERE DATE = "2022-09-01"[{
"rowCount": "1535341",
"beaconCount": "268409228"
}]So with the Akamai mPulse RUM dataset on 2022-09-01, there are 1.5 million aggregation rows that represent 268 million page loads (from the sampled and aggregated dataset).
Grouping
RUM Archive data can utilize standard GROUP BY SQL clauses to group data.
For example, to look at the distinct HTTP Protocol (PROTOCOL) dimensions for one day:
SELECT  PROTOCOL
FROM    `akamai-mpulse-rumarchive.rumarchive.rumarchive_page_loads`
WHERE   DATE = "2022-09-01"
GROUP BY PROTOCOL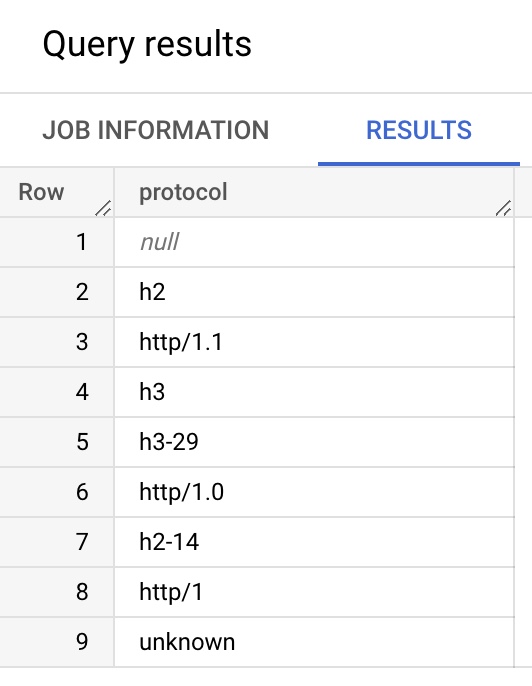
Filtering
RUM Archive data can utilize standard WHERE SQL clauses to filter dimensions.
For example, to filter to just COUNTRY = 'US':
SELECT  PROTOCOL,
        SUM(BEACONS) as COUNT
FROM    `akamai-mpulse-rumarchive.rumarchive.rumarchive_page_loads`
WHERE   DATE = "2022-09-01"
    AND COUNTRY = 'US'
GROUP BY PROTOCOL
ORDER BY COUNT(*) DESC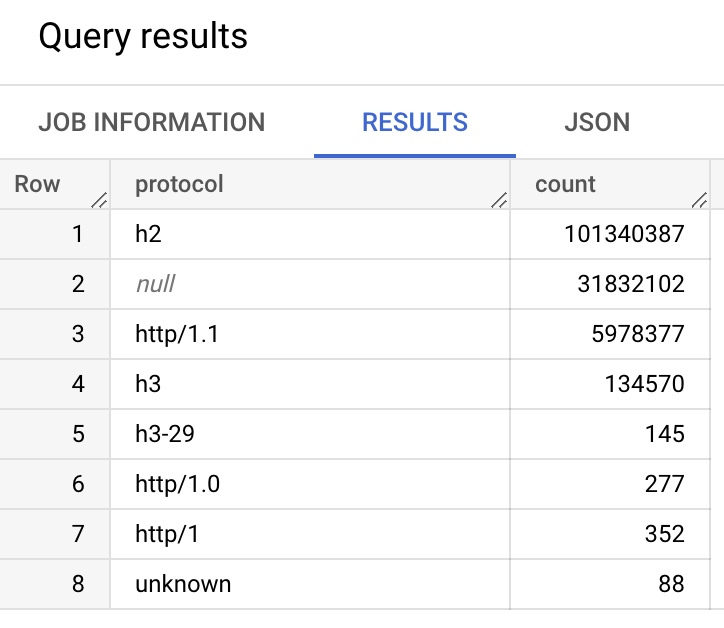
Calculations
From these rows and columns, you should be able to calculate:
- Relative weights (popularity) of dimensions within the dataset
- Statistics about each timer and metric:
- Approximate histograms
- Approximate percentiles (for all percentiles 0 through 100)
- Weighted averages
- Geometric means
Relative Weights
An important aspect of RUM Archive data is that many datasets will provide sampled data.
As a result, the BEACONS and xyzCOUNT columns do not represent 100% of the data that happened in the real world. One should not look at a BEACONS count of 100 and assume there were exactly 100 experiences that match the dimensions on that DATE.
What can be understood from the BEACONS and xyzCOUNT columns is relative weighting -- that is, for a single DATE, if you look at all matching values for a Dimension and compare them to other matching values, you can understand the relative weighting for that day of the dimension.
SELECT  PROTOCOL,
        SUM(BEACONS) as COUNT
FROM    `akamai-mpulse-rumarchive.rumarchive.rumarchive_page_loads`
WHERE   DATE = "2022-09-01"
GROUP BY PROTOCOL
ORDER BY COUNT(*) DESC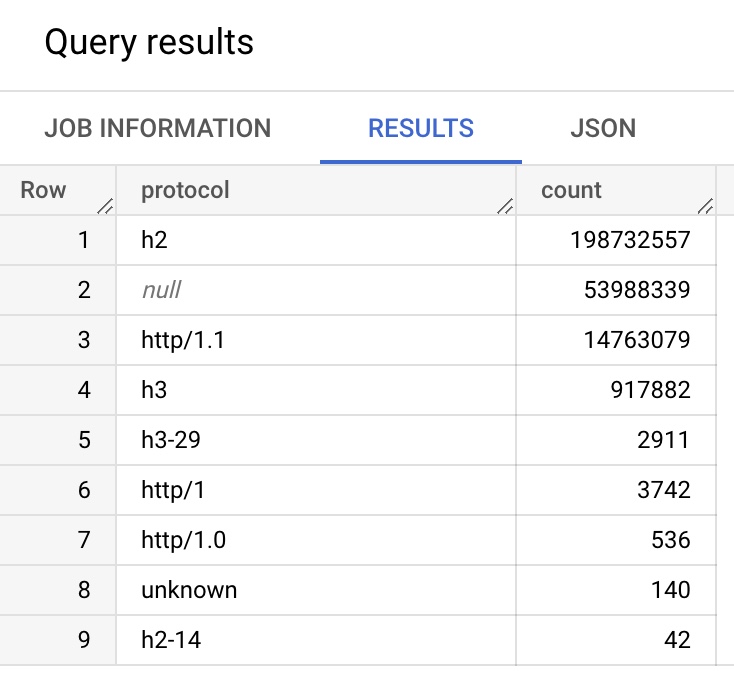
Combined Histograms
For each row, each timer and metric in the RUM Archive contains a histogram of values based on fixed-sized buckets.
You can combine multiple row's histograms to calculate a histogram (frequency distribution) for aggregated rows.
The akamai-mpulse-rumarchive project provides a public BigQuery function COMBINE_HISTOGRAMS() that can combine multiple row's histograms into a combined histogram:
CREATE OR REPLACE FUNCTION `akamai-mpulse-rumarchive.rumarchive.COMBINE_HISTOGRAMS`(
    histograms ARRAY<STRING>
)
RETURNS STRING
LANGUAGE js
AS ...
The COMBINE_HISTOGRAMS() function takes a single argument:
histograms ARRAY<STRING>: You can utilize the BigQueryARRAY_AGG()function to pass in the timer or metricxyzHistogramcolumn of choice
Example:
SELECT  COUNTRY,
        COUNT(*) AS ROWCOUNT,
        SUM(BEACONS) AS BEACONCOUNT,
        `akamai-mpulse-rumarchive.rumarchive.COMBINE_HISTOGRAMS`(ARRAY_AGG(PLTHISTOGRAM)) AS PLTHISTOGRAM
FROM    `akamai-mpulse-rumarchive.rumarchive.rumarchive_page_loads`
WHERE   DATE = "2022-09-01"
GROUP BY COUNTRY
ORDER BY SUM(BEACONS) DESC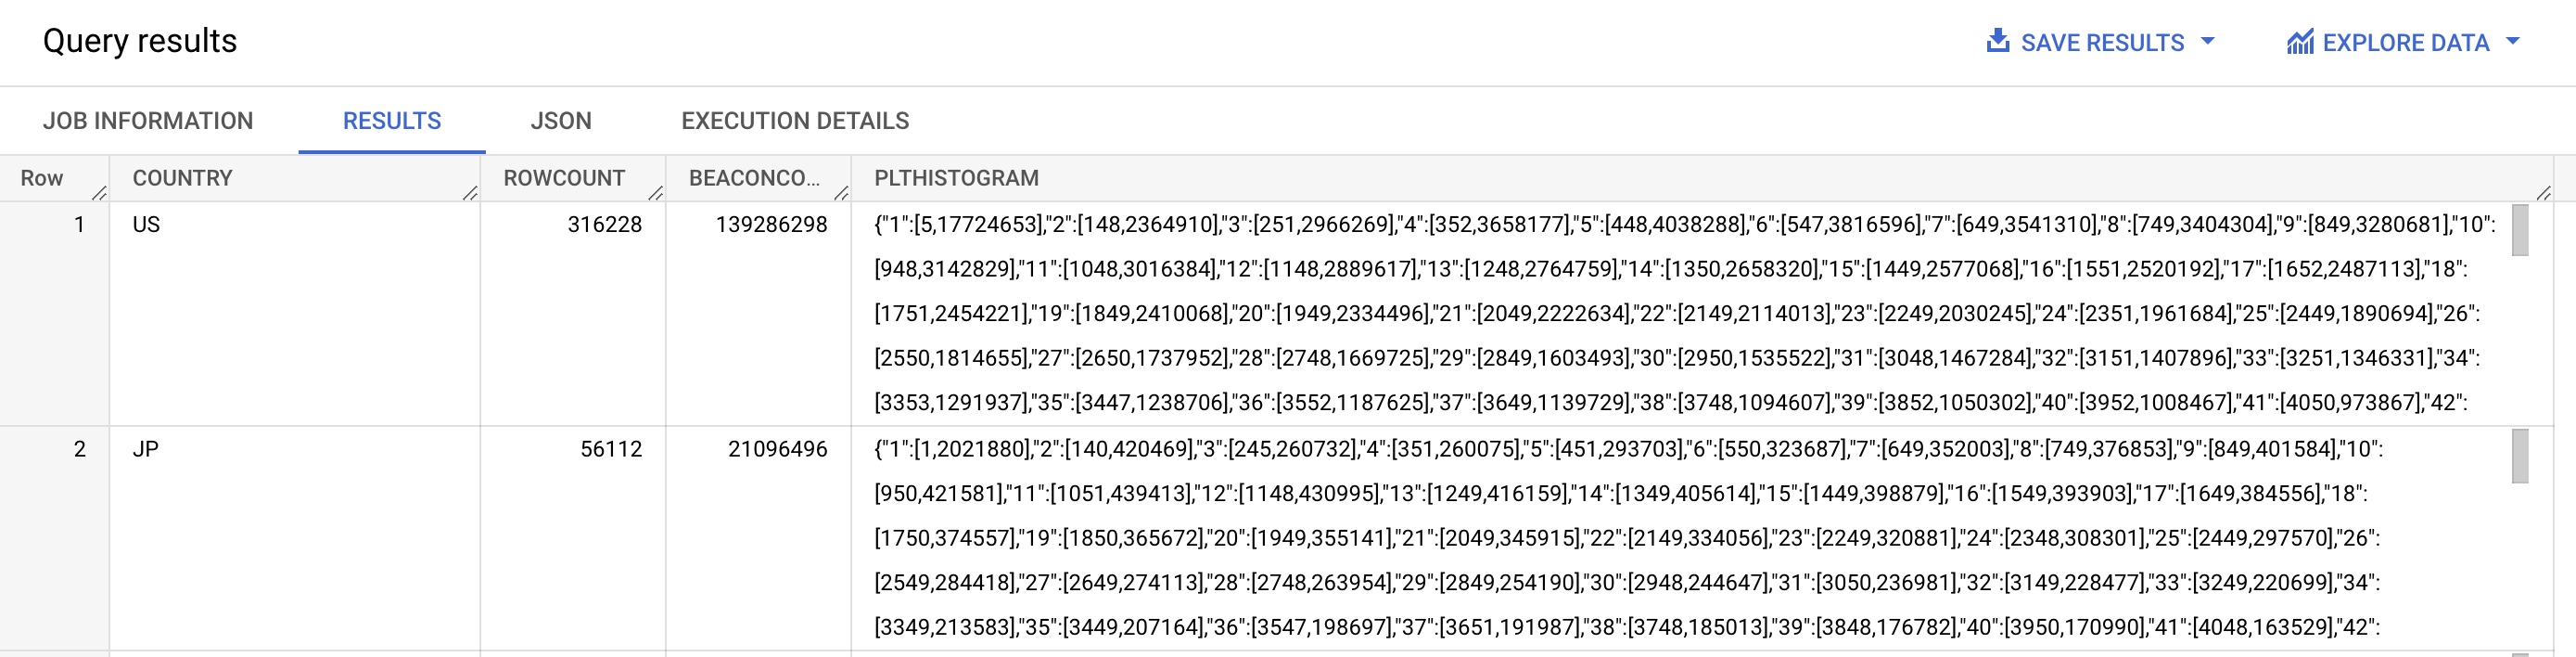
Note the use of the BigQuery ARRAY_AGG() to pass the PLTHISTOGRAM column to the COMBINE_HISTOGRAMS() function.
Approximate Percentiles
By Combining Histograms of multiple rows, approximate percentiles can be calculated for the matched data.
The akamai-mpulse-rumarchive project provides a public BigQuery function PERCENTILE_APPROX() that can calculate the approximate percentile for any matching rows.
CREATE OR REPLACE FUNCTION `akamai-mpulse-rumarchive.rumarchive.PERCENTILE_APPROX`(
    histograms ARRAY<STRING>,
    percentiles ARRAY<FLOAT64>,
    highPrecisionBucketWidth INTEGER,
    includeZero BOOL)
RETURNS STRING
LANGUAGE js
AS ...
The PERCENTILE_APPROX() function takes several arguments:
histograms ARRAY<STRING>: You can utilize the BigQueryARRAY_AGG()function to pass in the timer or metricxyzHistogramcolumn of choicepercentiles ARRAY<FLOAT64>: An array of percentiles you'd like calculated- A single value in the array (e.g.
[0.5]) will return anINTEGERresult - Multiple values in the array (e.g.
[0.25, 0.5, 0.75]) will return a JSON map of input percentiles to their calculations
- A single value in the array (e.g.
highPrecisionBucketWidth INTEGER: The width of the timer or metric's High Precision bucket, i.e.100for Page Load TimeincludeZero BOOL: Whether or not to include0values in the percentile calculation
Example:
SELECT  COUNTRY,
        COUNT(*) AS ROWCOUNT,
        SUM(BEACONS) AS BEACONCOUNT,
        `akamai-mpulse-rumarchive.rumarchive.PERCENTILE_APPROX`(
          ARRAY_AGG(PLTHISTOGRAM),
          [0.0, 0.25, 0.50, 0.75, 0.90, 0.95, 1.0],
          100,
          false) as PERCENTILES,
        `akamai-mpulse-rumarchive.rumarchive.PERCENTILE_APPROX`(
          ARRAY_AGG(PLTHISTOGRAM),
          [0.50],
          100,
          false) as MEDIAN
FROM    `akamai-mpulse-rumarchive.rumarchive.rumarchive_page_loads`
WHERE   DATE = "2022-09-01"
GROUP BY COUNTRY
ORDER BY SUM(BEACONS) DESC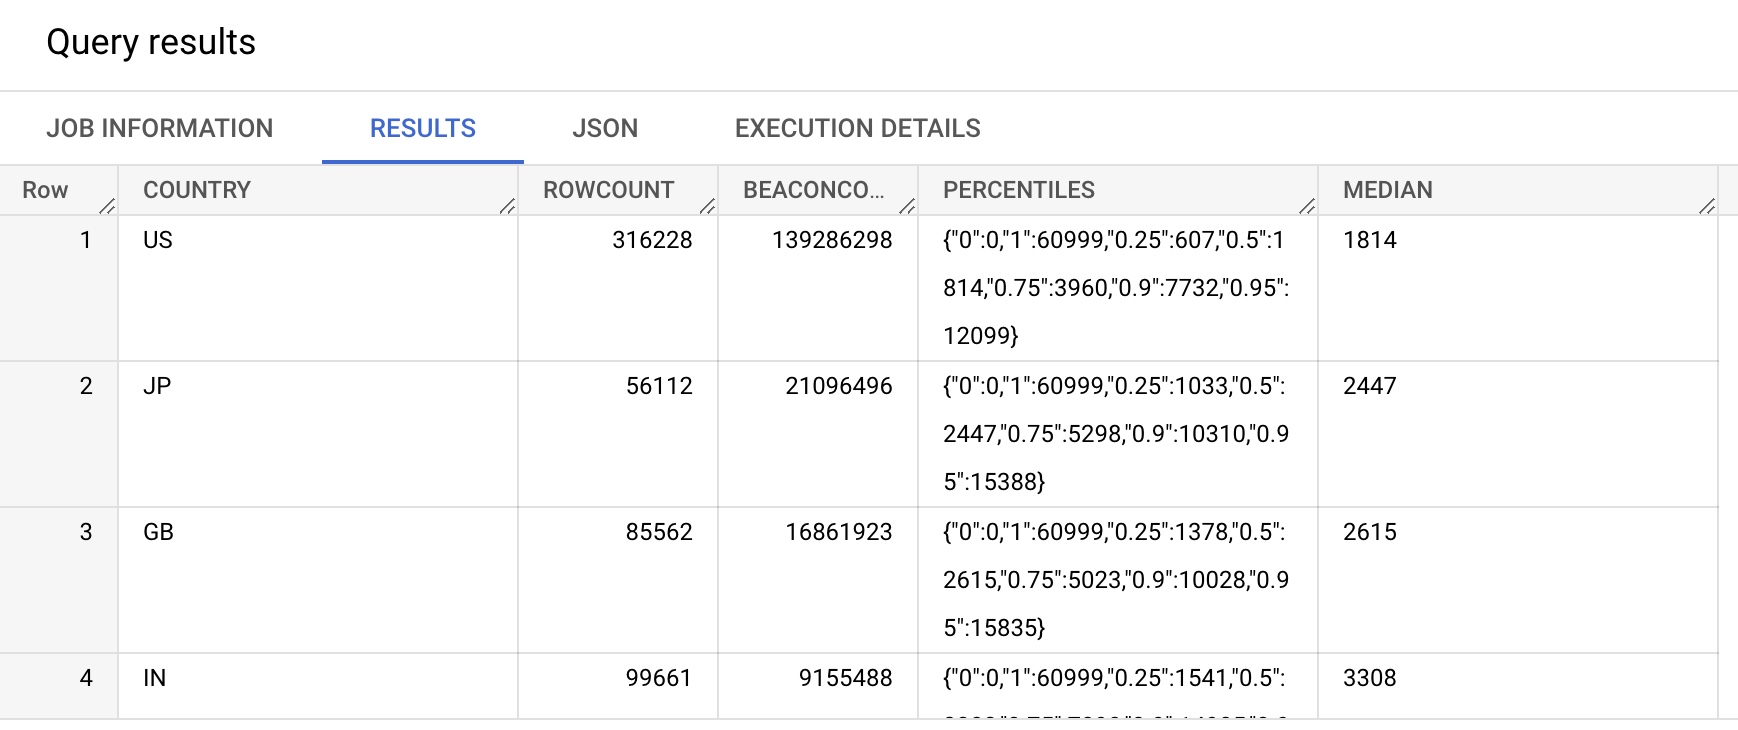
includeZero determines whether or not to include 0 values in the percentile calculation. If set to false, percentile calculations will start at values greater than 0. If set to true, percentile calculations will include all values that are 0 as well.
For some timers or metrics, it may make sense to include zeros, such as Cumulative Layout Shift (CLS), where a value of 0 is valid and considered "good".
Another scenario for setting includeZero=true would be when you want to look at the "all visitors' experiences" in a certain metric (or not), such as DNS:
- If you set
includeZero=falsefor DNS, you would only calculate the duration of DNS when it needed to be looked up. - If you set
includeZero=truefor DNS, it would calculate out of all experiences, including cached DNS, how long did it take to go through the DNS phase?
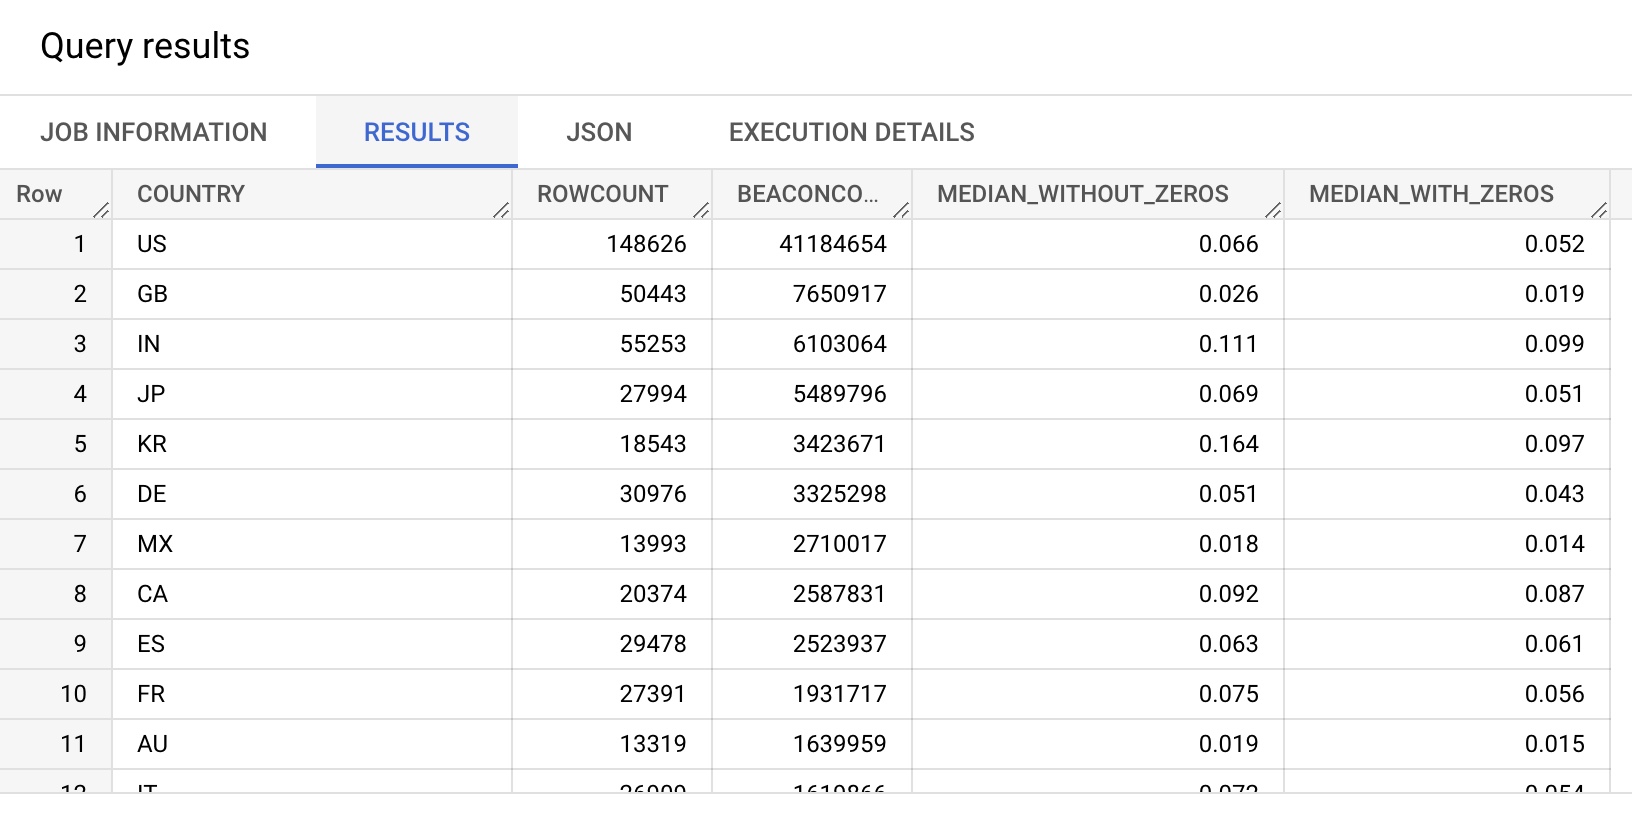
For example, setting includeZero for metrics like CLS will affect the results:
SELECT  COUNTRY,
        COUNT(*) AS ROWCOUNT,
        SUM(BEACONS) AS BEACONCOUNT,
        PARSE_NUMERIC(`akamai-mpulse-rumarchive.rumarchive.PERCENTILE_APPROX`(
          ARRAY_AGG(CLSHISTOGRAM),
          [0.50],
          10,
          false)) / 1000 as MEDIAN_WITHOUT_ZEROS, -- includeZero: false
        PARSE_NUMERIC(`akamai-mpulse-rumarchive.rumarchive.PERCENTILE_APPROX`(
          ARRAY_AGG(CLSHISTOGRAM),
          [0.50],
          10,
          true)) / 1000 as MEDIAN_WITH_ZEROS -- includeZero: true
FROM    `akamai-mpulse-rumarchive.rumarchive.rumarchive_page_loads`
WHERE   DATE = "2022-09-01"
    AND CLSCOUNT > 0
GROUP BY COUNTRY
ORDER BY SUM(BEACONS) DESC
A few differences from the last query:
includeZerois set totruefor one of the columns,falsefor the other- CLS has a High Width of
10 - CLS should be divided by
1000, and utilizesPARSE_NUMERIC()to do so - The
CLSCOUNTclause ensures the query only looks at rows that had a CLS calculation
Weighted Averages
Each timer and metric contains two columns that can be used to calculate a weighted average (weighted arithmetic mean).
Note: We generally don't recommend using averages when looking at performance metrics, as the distributions tend to be normal (or log-normal), and outliers can affect the data. Use approximate percentiles instead. For a longer explanation, SpeedCurve has a great article on Averages, medians & percentiles.
- A
xyzCOUNTcolumn - A
xyzAVGcolumn
Example calculating the weighted average of Page Load Time by Country (and comparing it to the Median, so you can see how they differ):
SELECT  COUNTRY,
        COUNT(*) AS ROWCOUNT,
        SUM(BEACONS) AS BEACONCOUNT,
        ROUND(SUM(PLTAVG * PLTCOUNT) / SUM(PLTCOUNT)) AS PLTAVG,
        `akamai-mpulse-rumarchive.rumarchive.PERCENTILE_APPROX`(
          ARRAY_AGG(PLTHISTOGRAM),
          [0.50],
          100,
          false) as PLTMEDIAN
FROM    `akamai-mpulse-rumarchive.rumarchive.rumarchive_page_loads`
WHERE   DATE = "2022-09-01"
GROUP BY COUNTRY
ORDER BY SUM(BEACONS) DESC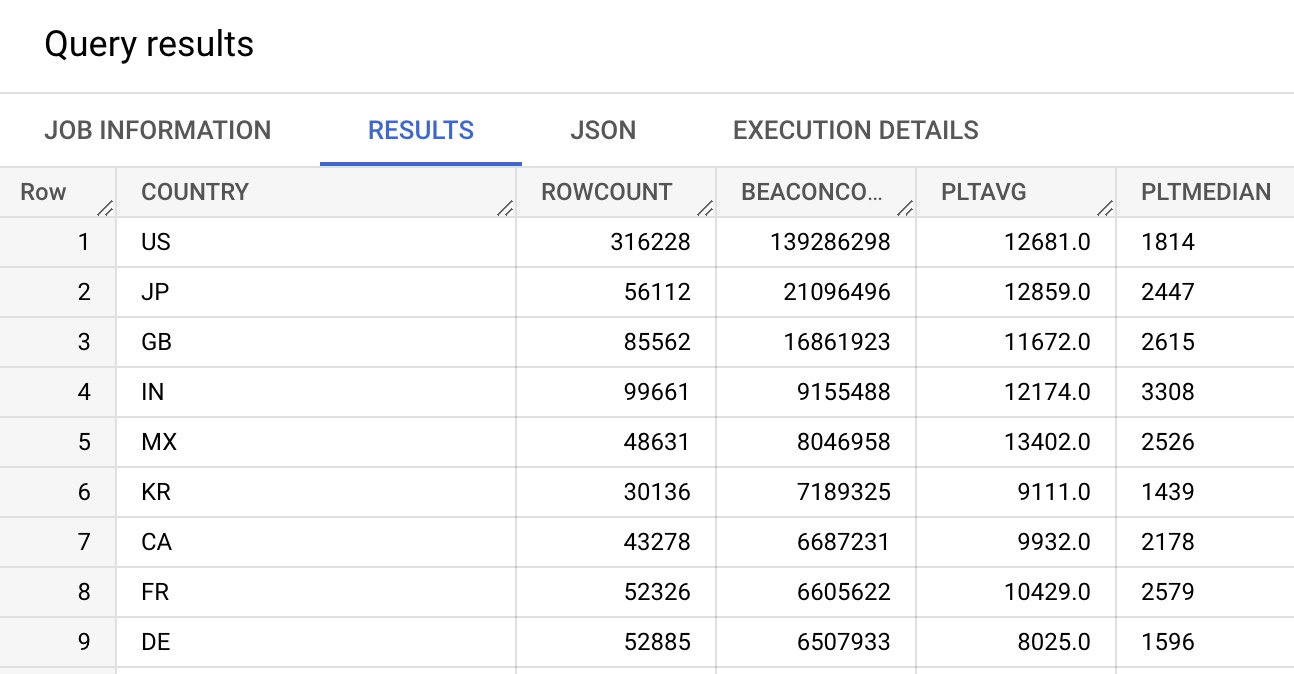
Weighted Geometric Means
Each timer and metric contains two columns that can be used to calculate a weighted geometric mean.
- A
xyzCOUNTcolumn - A
xyzSUMLNcolumn
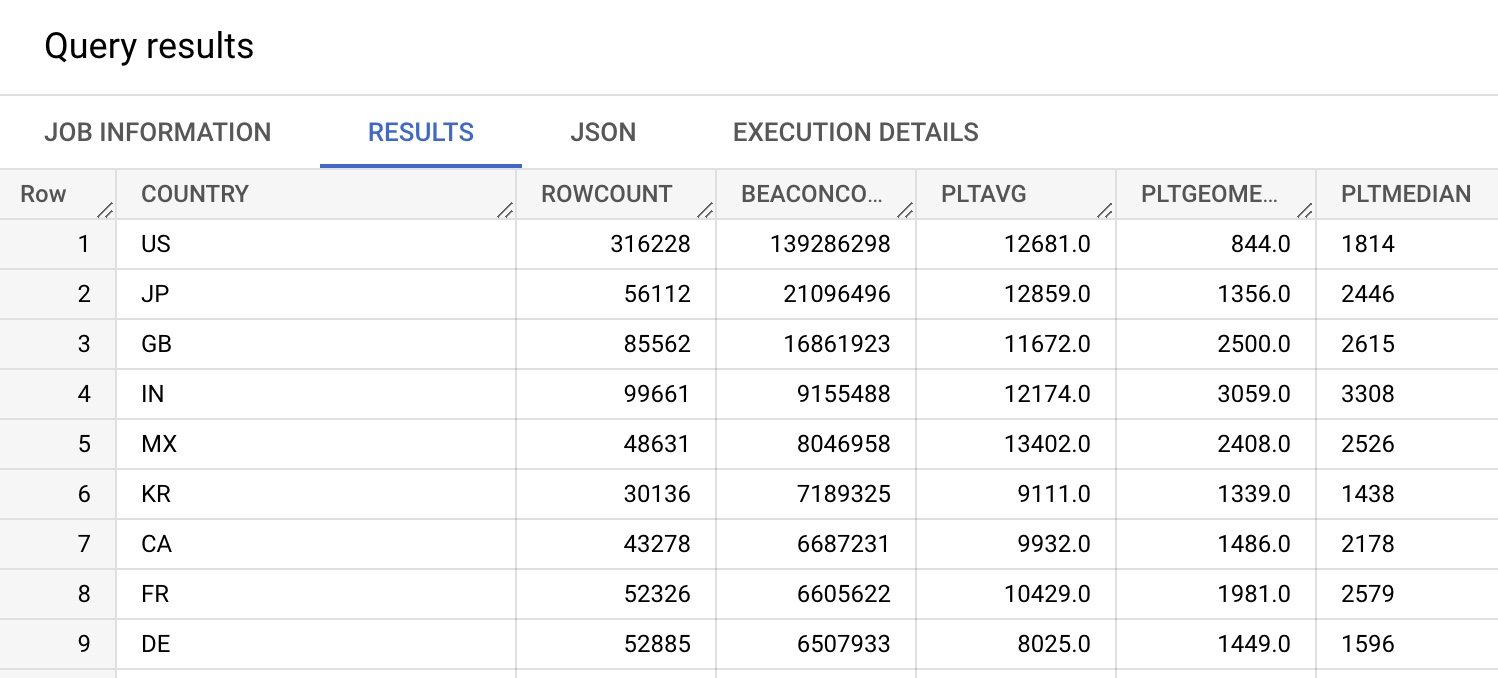
Example calculating the weighted geometric mean of Page Load Time by Country (and comparing it to the weighted geometric mean, and Median, so you can see how they differ):
SELECT  COUNTRY,
        COUNT(*) AS ROWCOUNT,
        SUM(BEACONS) AS BEACONCOUNT,
        ROUND(SUM(PLTAVG * PLTCOUNT) / SUM(PLTCOUNT)) AS PLTAVG,
        ROUND(EXP(SUM(PLTSUMLN) / SUM(PLTCOUNT))) AS PLTGEOMEAN,
        `akamai-mpulse-rumarchive.rumarchive.PERCENTILE_APPROX`(
          ARRAY_AGG(PLTHISTOGRAM),
          [0.50],
          100,
          false) as PLTMEDIAN
FROM    `akamai-mpulse-rumarchive.rumarchive.rumarchive_page_loads`
WHERE   DATE = "2022-09-01"
GROUP BY COUNTRY
ORDER BY SUM(BEACONS) DESC