RUM Insights
By Robin Marx on
Table of Contents
RUM Insights are now available!
For this past year, the RUM Archive website has mainly been a README with instructions on how to query the archive's database yourself and how to interpret the results.
However, we recognize that setting this up yourself can be a big technical (and financial) hurdle to using the wealth of data the archive contains.
As such, we now also provide RUM Insights: a collection of pre-made visualizations and diagrams for results from typical queries you might want to run against the database! These visualizations will be refreshed monthly with the latest data, to make sure you always have the freshest data to work from.
We will focus on showing data that makes the RUM Archive unique: insights about how real users visit pages, about how Web platform features are used in the wild and how this impacts real-world performance for a distributed audience.
At this time, the available visualizations are still somewhat limited in number, but we intend to expand upon them considerably in the near future. We also welcome your input on what you would like to see there going forward.
Interpreting the results
On the RUM Insights page itself, we intentionally display only the data without interpretations, as those always have some inherent biases that might not hold for everyone.
Instead, we will periodically write a new blog post (like this very one!) to share some of our interpretations of the data and to highlight some interesting things we might have seen in recent months.
This blog post will focus on results up to September 1st, 2023.
High level market shares
As the RUM Archive data contains page loads from a huge variety of Akamai visitors, we can use it to get an estimate of how widespread individual platforms are in practice.
Let's take a look at which devices, operating systems and browsers we see in the wild.
Devices

Akamai's Boomerang currently tracks three different types of devices: Desktop, Mobile and Tablet. As we can see in the image, we have a rather outsized representation of Mobile visitors, having nearly twice as many visitors (61% mobile vs 34% desktop) loading pages on their phones.
It is important to note that this distribution is not necessarily representative for all websites and countries, as Akamai's customers are somewhat biased to the richer, western countries. Still, it is undeniable that mobile visits have only gained in importance the past few years, and optimizing for mobile performance should be on the top of your to-do list.
Note that there are also some interesting fluctuations in the data, where sometimes mobile goes up to 70%. We have yet to research where these are coming from (potentially because we're currently sampling different days of the week for the visualizations).
Operating Systems

Looking at the different Operating Systems, we see that on Desktop Windows is still clearly king (70%) with Mac OS a distant second (22.5%).

The results for Mobile confirm the bias towards richer countries I mentioned above: iPhones running iOS are very dominant, representing over 60% of all mobile page loads, leaving Android behind at about 35%. Other mobile Operating Systems didn't manage to get over 1% market share and are not shown in the diagram.
Again though, this does not mean you should disregard Android and focus all efforts on iOS: in some countries, there are definitely more Android users and you should use your own RUM data to identify who your end users are.
We plan to further split this data by country in the RUM Insights in the future to give a more nuanced view on this dimension.
Browsers

Finally, let's look at the different browsers end users like to use. For Desktop, there is an overwhelming preference for Google Chrome, with Edge being an interesting second, before Safari. Given that Mac OS had a 22.5% market share in terms of Operating Systems, this indicates that many users prefer Google Chrome over Safari even on the Apple OS.

This is interesting, as for the Mobile browsers, the results are almost the opposite. This is of course again biased due to the outsized presence of iOS users, but there people tend to prefer Safari, despite other browsers like Chrome also being available on iOS.
It's also interesting to note the presence of the "WebView" entries. These typically signify so-called "in-app browsers", where apps like Facebook or YouTube might open webpages inside the app instead of in the full browser. Internally, they use the browser's implementation of course, showing up as the WebViews.
Core Web Vitals
In terms of Web Performance, it is important to note the high prevalence of iOS and the accompanying Safari use. This is because browsers on iOS don't support some of the most important Web performance metrics: Google's Core Web Vitals (CWVs).
What many users don't know, is that even if you use Chrome or Firefox on iOS, you're actually using Apple's WebKit browser engine internally, which is the same one that Safari uses. This is because Apple only allows WebKit on iOS. As such, despite these browsers being branded as Chrome or Firefox, internally, they basically behave like Safari.
Apple's WebKit does not currently implement support for the CWVs, a suite of metrics that Google uses in its SEO logic and which can impact search result rankings. As such, for any iOS traffic, Web performance optimizers are largely blind to how well the pages actually perform on those devices, at least in terms of the CWVs.
As such, if your end-users are coming mostly from iOS (which is clearly the case for the current RUM Archive data), Google is not taking into account most of your actual traffic for SEO. Additionally, this also means that Web developers that use popular public datasets like Google's Chrome User Experience (CrUX) to help drive their efforts, are potentially forgetting about a large amount of their users, as they're basically only looking at Desktop and Android browsers.
To give an indication of how large this problem is, we've grouped the browsers that support the CWVs together. Then we've split them out into browsers whose data is present in CrUX (basically only Google's Chrome itself) and other Chromium-based browsers (which do support the CWVs, but whose data is not included in CrUX).
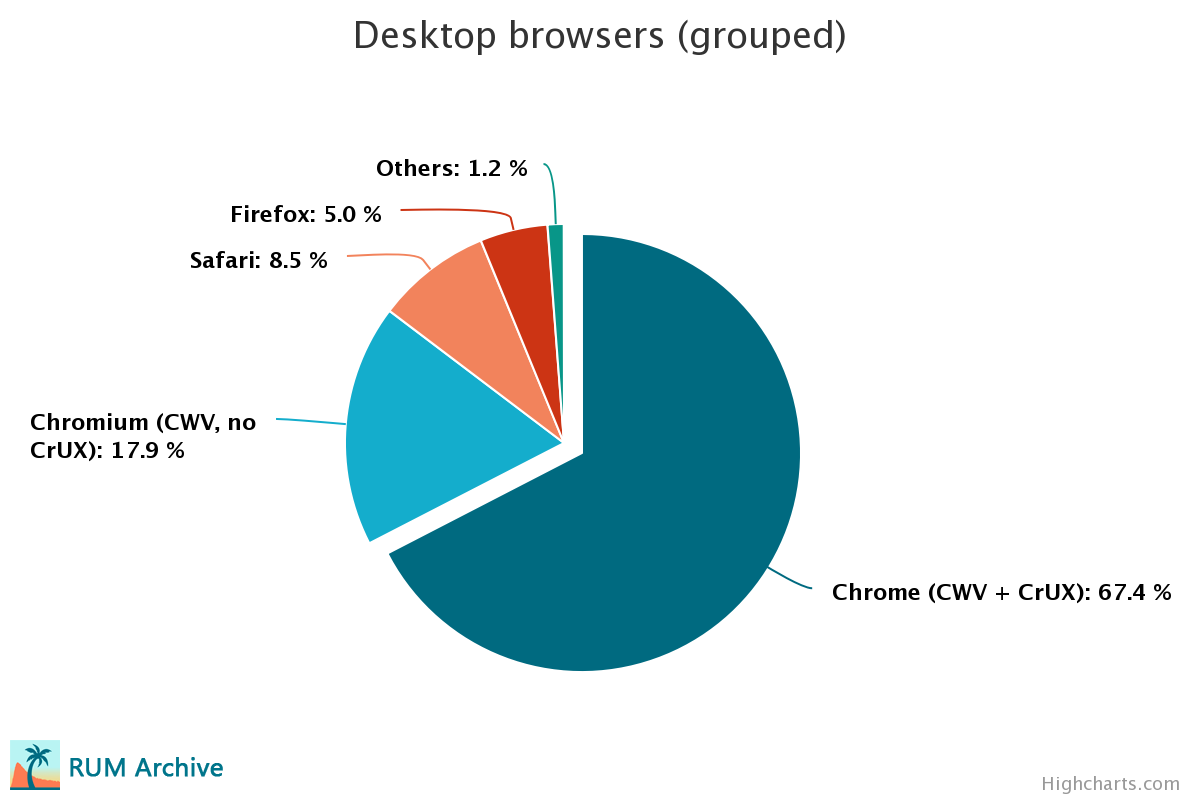
As you can see, on Desktop CrUX, covers about 67% of all page loads in the RUM Archive, which is probably enough to give a good general approximation.
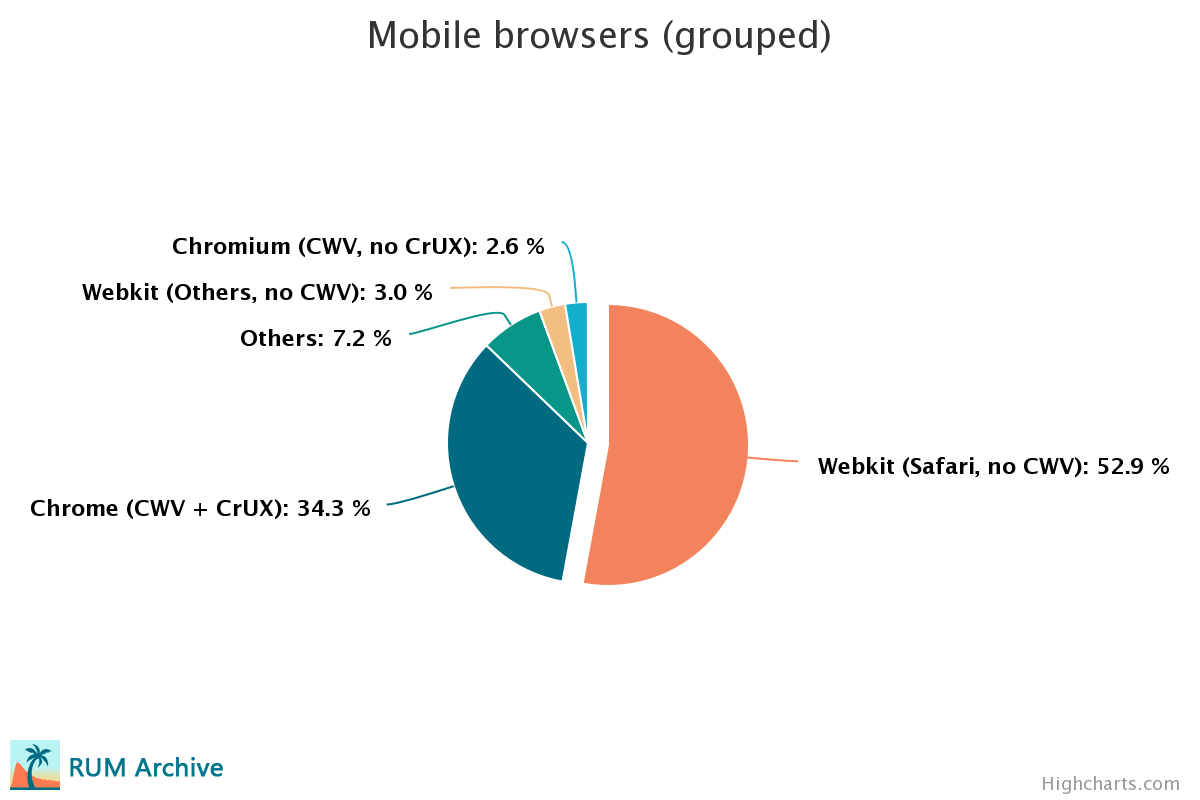
However, on Mobile, CrUX only covers 34% of all page loads, all on Android. As such, a large majority of end users that are routed through Akamai are not captured in CrUX, and Akamai customers should take care to test their sites on iOS and Safari through other means.
Navigational Aspects
While for performance measurements and optimization we often focus on a full page load in its own tab (often as first page in a session) not all navigations are quite that straightforward.
As Akamai expert Tim Vereecke discussed in his recent talk Noise Cancelling RUM, RUM data is can contains a lot of "noise" due to different ways of loading Web pages, and it's often important to filter out that noise to make sure you're analyzing the correct data.
Navigation Types
The RUM Archive currently tracks three different types of navigations:
- Navigation is a typical navigation by for example clicking on a link.
- Reload is when the user manually reloads the page.
- Back-forward is when the user uses the back and forward buttons to navigate in their history.


As we can see, "normal" navigations are of course the most prevalent. However, it is interesting to note a relatively high amount of reloads as well. While reloads are often from Developers testing changes to the pages, rising reload numbers can also indicate problems with your site, as users have to force reload pages due to some error.
Additionally, it's clear that back-forward navigations are more prevalent on Mobile, where they are of course made easier by the support for hand gestures. Still, I personally would have expected the number to be even higher on Mobile.
As reloads and back-forward navigations often have very different performance characteristics than "normal" navigations, it's recommended to filter them out when doing typical Web performance analyses.
Visibility States
Pages do not always load in a fully visible state. Currently, we track three different options:
- Visible typically means the user watched the page load happen.
- Hidden is for example when the user clicks to open the page in a new (yet hidden) tab.
- Partial is when the page load starts hidden, but the user switches to the still rendering page before it's done (for example, they rapidly switch to a background tab). The inverse is also possible, where the user switches away from the page before it's fully rendered.

The data shows again that, while fully visible navigations are the norm, there is an important amount of hidden page loads as well. Especially on Mobile they represent about 14% of all loads.

The fact that they're so much more prevalent on Mobile than Desktop (14% vs 6.6%) indicates that users on the move typically load more pages in the background. This can again just be because it's easier on Mobile platforms, or it can be that users expect Mobile pages to be slower and don't want to sit around waiting for them to load, and prefer to have this done in the background. Again, if you see Hidden navigations go up, this might mean your end users perceive your pages as slow.
This is important to take into account, as Hidden page loads often report very different metrics than Visible page loads (as visibility metrics like Largest Contentful Paint seem to happen instantly, as the previously Hidden page is apparently "immediately" rendered when switching to its tab).
Landing Pages
When talking about longer user session (end users visiting multiple pages in a row on a site), there's a difference between the very first page in that session and all the other pages.
The first page is typically called the "Landing Page". This does not always have to be the "homepage", as it can be any page of a site, as long as it is the first a user visits. This first page usually has different performance characteristics, as the user might need to establish a new connection to the server, and many resources might not yet be in the browser's cache.
A session is typically (though not always) defined as a series of navigations separate by no more than 30 minutes (after 30 minutes, the session automatically ends and the next navigation starts a new session).

The data suggests that Landing Page loads are clearly the minority of navigations, though a bit higher on Mobile than Desktop (potentially indicating that users visit fewer pages during the same session on Mobile for some reason).

More importantly though, this means that if you're assessing your page's performance just by doing a "cold load" (which is common practice for synthetic testing tools like the browser's DevTools, Lighthouse or WebPageTest), you're only looking at the smaller subset of all your end users' experiences. It is important to also consider your performance for subsequent pages, which can be made faster by for example using resource caching effectively.
Multi-page versus Single-page Apps
A final navigational aspect to take into account is whether you're using a Multi- or Single-page app. Multi-page apps are what I would call the "typical" website, where each page is individually rendered on the server and each navigation fetches the (full) HTML content from the server (or from a cache).
However, recent years have seen the rise of "Client Side Rendering", where the server is instead mainly used as an API endpoint to fetch data (for example in JSON format), and where a JavaScript framework (like React or Vue) renders this to HTML in the browser. This is typically called a "Single Page" app, since the user doesn't actually navigate to a new page: each link click is a background API fetch that is then rendered inside the original page's context.
Note, the above is a very un-nuanced explanation of the complex modern Single Page App ecosystem, as most frameworks now also allow a form of Server Side Rendering. Still, for our purposes here, it is adequate, as the main takeaway is that many performance metrics are measured differently (or are simply not available at all!) for Single-Page apps compared to Multi-Page apps. As such, it is important to take this into account when doing performance analyses.

We can get a generally idea of how many SPAs Akamai is fronting from the RUM Archive data. We currently track three different loads: MPA, SPA Hard Navigations (the first navigation to the page) and SPA Soft Navigations (in-page route changes).
We can see that, while MPAs are still the majority (64%), the use of SPAs is clearly also widespread at 36% (more widespread than I personally would have expected before querying the RUM Archive). This means that many of you reading are probably using a SPA framework and should be aware of how this impacts performance and perf metrics.

Interestingly, the amount of SPA Hard Navigations are higher on Desktop than Mobile, indicating that Mobile users stay on the same SPA longer. This seemingly contradicts our findings in the previous section, where we found more Landing Pages on Mobile (which should conceptually be equivalent to SPA Hard Navigations). We need more research to definitely say why this is, but it might be SPAs indeed provide superior end user experiences on Mobile and thus users stick with them (slightly) longer. However, the differences are quite small (< 2%) so it might not be significant at all. Still interesting to think about though :)
Conclusion
With that, we've reached the end of the first RUM Insights discussion post. Expect more of these to come in the future, as we add additional diagrams to the RUM Insights page or if we find interesting changes in the data from month to month.
As we said on top, the list of visualizations is (intentionally) limited for now, but we plan to expand them soon. If you have any thoughts or ideas on what we should include in our default set of diagrams, let us know on GitHub!
Finally, note again that these are my personal interpretations of and opinions on the data shown. These interpretations are inherently biased in many ways and they are not necessarily correct, or correct in all contexts. Take care when analyzing large data sets, and make sure to use your own RUM solution on your pages as well (for example, Akamai's mPulse), to track your real end users' experiences.